Phys. Rev. B, June 15 (1998) Electron energy loss function of LiTaO3 and LiNbO3by x-ray photoemission spectroscopy: Theory and experiment Shigemi Kohiki Kyusyu Institute of Technology, Faculty of Engineering, Department of Materials Science, Tobata, Kita-kyusyu 804, Japan and National Institute for Research in Inorganic Materials, Tsukuba, Ibaraki 305, Japan Masao Arai, Hideki Yoshikawa and Sei Fukushima National Institute for Research in Inorganic Materials, Tsukuba, Ibaraki 305, Japan (Received: December 29, 1997; We report experimental energy loss structures in x-ray photoemission spectra of single crystalline LiTaO3 and LiNbO3, and then compare these with theoretical electron energy loss functions calculated from first principles using the full-potential linearized augmented plane wave method in the local density approximation. The energy loss structure of core electrons can be approximated by a sum of four components. For LiTaO3 the peaks positioned at 8.0, 13.4, 15.8 and 22.6 eV. For LiNbO3 those positioned at 7.0, 12.0, 14.5 and 21.8 eV. The momentum matrix elements between Bloch functions were evaluated to determine the electron energy loss functions. The theoretical electron energy loss functions agreed fairly well with experimental one. The experimental peaks positioned at 8.0, 13.4 and 15.8 eV for LiTaO3 and those at 7.0, 12.0 and 14.5 eV for LiNbO3 were assigned to the interband transitions from the valence band to the conduction bands. The peaks at 22.6 eV for LiTaO3 and 21.8 eV for LiNbO3 were ascribed to the electron excitation from the O 2s level to the lower conduction band. Aside from technological efforts in thin film applications to develop piezoelectric, pyroelectric, electro-optic and nonlinear optical devices, the electronic structure and dielectric functions of lithium tantalate (LiTaO3) and lithium niobate (LiNbO3) are of fundamental interests, though a few study1-4 for LiTaO3 and several studys1-9 for LiNbO3 were available in limited energy range. Previously reported electron energy loss functions measured by both electron energy loss spectroscopy (EELS)5 and X-ray photoemission spectroscopy (XPS)1,6,9 were predicted by experimental optical energy loss function. To our knowledge, this report is the first one to elucidate the experimental energy loss functions of LiTaO3 and LiNbO3 using a first-principles computation of dielectric functions. XPS is suitable to examine the electronic structure of the filled levels and dielectric response of a solid. During the approach of a excited electron to the solid surface, the Coulomb field accompanied with the moving electron interacts with the electrons of the solid via long-range dipole fields. The long-range Coulomb interactions bring about interband transitions and plasma excitations. High-resolution XPS can reveal the characteristic energy loss structure due to interband transition and plasmon excitation of the valence electrons on the lower kinetic energy side of core lines. The crystal structures of LiTaO3 and LiNbO3 are almost identical and are rhombohedral R3c at room temperature. The rhombohedral unit cell (a=5.4740ü,ā┐=56.175o for LiTaO310 and a=5.4944ü, ā┐=55.874o for LiNbO311) contains two formula units for total ten atoms. Li and Ta or Nb ions are on the c-axis and form triangular layers in the x-y plane. O ions also form approximate triangular layers but are slightly off-center to the c-axis. The off-center O ions are believed to be the source of ferroelectricity and its large optical nonlinearity. The scarcity of the theoretical study may be due to low crystal symmetry. The spectra of photoelectron excited with monochromatized Al Kā┐ radiation were measured using a hemispherical electron spectrometer under a pressure less than 5 x 10⁻⁸ Pa at room temperature. The spectrometer was calibrated utilizing Au 4f7/2 (83.9 eV) and Ag 3d5/2 (368.3 eV) electrons. The resolution of the spectrometer, defined as the full width at half maximum (FWHM) of the Ag 3d5/2 line was 0.59 eV. The crystals grown from a stoichiometric melts, LiTaO3 of 0.5 mm thick with the (001) orientation (Sinetsu Chemical Corporation) and LiNbO3 of 0.5 mm thick with the (001) orientation (Sumitomo Metal Mining Corporation) were used in this experiment. The samples were repeatedly cleaned in acetone and methanol with ultrasonic vibration, and then transferred into the preparation chamber of the spectrometer. The samples showed a very small C 1s signals of the adventitious carbon (C-C and C-H) of the order of a submonolayer. As LiTaO3 and LiNbO3 are insulators, charging effects were observed during x-ray irradiation. To stabilize the XPS spectra, the sample surface was flooded with low energy (5 eV) electrons from a neutralizer and the Fermi energy of the sample was determined from the C 1s electron binding energy (285.0 eV) of the adventitious carbon. Core electrons in the orbitals shallower than Li 1s, Ta 4s, Nb 3s and O 1s can be excited by Al Kā┐ radiation. The most intense and best resolved line is the O 1s for both LiTaO3 and LiNbO3. The core lines are followed by energy loss structure ranging from 5 to 30 eV relative to the zero loss line. Within the experimental uncertainty the energy loss structure is the same for the remaining core lines. The spectra of the Ta 4f for LiTaO3 and the Nb 3d for LiNbO3 show the identical energy loss structure to that observed for the O 1s spectra, though they are more complicated due to 4f or 3d spin doublet and overlapping of other lines (Ta 5p). As shown in fig.1, the loss structure can be approximated by a sum of four components. The peaks positioned at 8.0, 13.4, 15.8 and 22.6 eV for LiTaO3. For LiNbO3 they positioned at 7.0, 12.0, 14.5 and 21.8 eV. The shape of loss spectrum for LiNbO3 in this XPS agrees fairly well to that of the EELS.5 Surface effect was examined for the O 1s, Ta 4f and Nb 3d spectra varying the electron take-off angle (āŲ) from 90 to 20 degrees. The effective sampling depth at āŲ=20 is smaller by 1/2.9 than that at āŲ=90. We found no evidences of the surface effect since there was no additional structure and change in the peak position. The observed energy loss structure in XPS reflects inevitably the surface electron energy loss function. Reduced local coordination of surface ions decreases the Madelung potential energies at the surface comparing with the bulk values, and causes the surface electronic levels in the bulk band gap (Eg). The valence band (VB) spectra of LiTaO3 and LiNbO3 are shown in fig.2. Positions of the valence band maximum (VBM), determined from the intercept of a linear fit to the right shoulder with zero line, of LiTaO3 and LiNbO3 were 3.6 and 2.7 eV below the Fermi level (EF), respectively. The difference of the VBM position (0.9 eV) between LiTaO3 and LiNbO3 is in good agreement with that in the Eg (1.0 eV) from the band calculation described below. Reported optical Eg of LiNbO3 is 3.78 eV.12 The experimental VBM of LiTaO3 and LiNbO3 suggests that the bulk EF is positioned at below about 1 eV from the bottom of the lower conduction band. Since no prominent emission from the region of bulk Eg was observed, the surface density of states (DOS) are largely empty. Alteration to the electron energy loss function is scarcely expected from the empty surface states. We calculated the bulk electronic structures of LiTaO3 and LiNbO3 within the local density approximation,13 using the WIEN97 package14 which is based on the full-potential linear augmented plane wave method. The atomic positions used in this calculation are given in refs. 15 and 16. The resulting DOS of LiTaO3 and LiNbO3 shown in figs.3 and 4, respectively, are very similar to each other and the only difference is in the energy gaps as reported by Inbar and Cohen.4 They agree well with the previous calculations.4,8 To obtain the electron energy loss functions, the imaginary part of dielectric functions (ā├) were calculated from the momentum matrix elements between the occupied and unoccupied wave functions. The real part, Re(ā├) was evaluated from the imaginary part, Im(ā├) by the Kramers-Kronig transformation. The electron energy loss functions of bulk -Im(ā├)-1, and surface -Im(ā├+1)-1, were derived from the Re(ā├) and Im(ā├) of the calculated dielectric functions. The Re(ā├) and Im(ā├) of the dielectric function and the -Im(ā├)-1 and -Im(ā├+1)-1 of LiTaO3 and LiNbO3 are shown in figs.5 and 6, respectively. The peaks in the -Im(ā├+1)-1 shifts to the lower energy side than in the -Im(ā├)-1. The prominent structures in the electron energy loss functions of LiTaO3 and LiNbO3 are similar to each other except the sharp peaks at around 25 eV for LiTaO3 as seen in figs. 5 and 6. Two wide bands with a complicated structure in the Im(ā├) of LiTaO3 and LiNbO3 are observed below 15 eV, though above 15 eV there is no clean-cut structure. Above 15 eV the sum of oscillator strengths for the valence electrons is exhausted. Small structures in the Im(ā├) of LiTaO3 and LiNbO3 at around 21 and 20 eV can be assigned to the electron excitation from the O 2s level to the lower conduction band. Another small structure at around 24 eV in the Im(ā├) for LiTaO3 is ascribed to the electron excitation from the Ta 4f levels to the lower conduction band. Theoretical energy loss functions showed their maxima at the energies of interband transitions (single-particle excitation) from the valence band to the splitting lower and upper conduction bands below 20 eV and from the near valence (O 2s and Ta 4f) levels to the lower conduction band between 20 and 30 eV. For LiTaO3, the theoretical loss functions, -Im(ā├)-1 and -Im(ā├+1)-1, shows the prominent features A, B and C below 15 eV attributed to the interband transitions from the valence band to the splitting lower and upper conduction bands, and the feature D ascribed to the electron excitation from the O 2s level to the lower conduction band. As shown in fig.5, in the theoretical loss functions the peaks should appear at around 25 eV, though no electron transition from the Ta 4f levels to the lower conduction band was observed experimentally as shown in fig.1. The disagreement arises from the incorrect position of Ta 4f levels in the calculations since the local density approximation underestimates the binding energies of the localized states. Compared with the experimental Ta 4f core binding energy, the calculated Ta 4f states appear at 6 eV higher energy region. If we shift the Ta 4f states to the experimental positions, the peaks by these states would disappear from the observed energy range. Therefore, the experimental energy loss peaks P1, P2 and P3 were originated from the interband transitions from the valence band to the lower and upper conduction bands. The experimental peak P4 was ascribed to the electron excitation from the O 2s level to the lower conduction band. For the assignment of the experimental energy loss peaks of LiNbO3, similar manner of discussion performed for LiTaO3 provides that the peaks P1, P2 and P3 originated from the interband transitions from the valence band to the lower and upper conduction bands, and the peak P4 was ascribed to the electron excitation from the O 2s level to the lower conduction band. The experimental P4 peaks are broader than the P1, P2 and P3 peaks for both LiTaO3 and LiNbO3 as shown in fig.1, though the D peaks in the calculations are expected to be sharp similar to other (A, B and C) peaks as shown in figs.5 and 6. The origins of the broadenings are unknown and may be attributed to several effects such as multiplet structures or electron correlations, which are neglected in the present calculations. Alternatively, the P4 peaks may be assigned to the bulk plasmon since the excitation energy estimated from O 2p valence electron density is about 21.6 eV in the free electron model. However, we do not find any clear indication of the plasmon in the calculated dielectric functions. The plasmon peaks may be smeared by the contribution of interband transitions and appear as the broad structures around 20 - 28 eV. More detailed calculations including momentum dependence are necessary to distinguish the plasmon excitation. We have presented the experimental and theoretical results on the electron energy loss functions of LiTaO3 and LiNbO3. The results of a first-principles calculation are in agreement with the energy loss structure in the core-level spectra. We anticipate the combination of approaches using electron spectroscopy and the first-principles computation to play a significant role in the materials design related to dielectric crystals. The authors thank T.Maruyama for assistance in the XPS measurement, and P.Blaha, K.Schwarz, and J.Luiz for providing us their WIEN97 programs. 1
S.Kohiki, S.Fukushima, H.Yoshikawa, M.Arai, Jpn. J. Appl.
Phys. 36, 2856 (1997) |
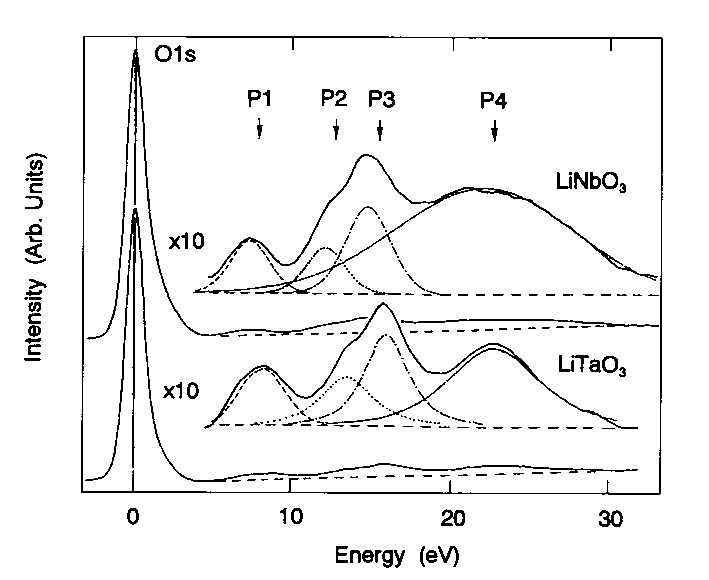 |
| Figure 1 Experimental electron energy loss spectra of LiTaO3 and LiNbO3. |
| ü@ |
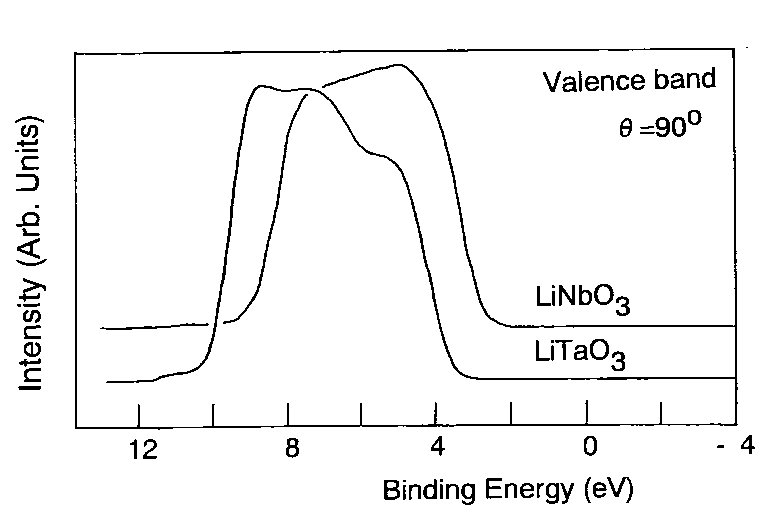 |
| Figure 2 Valence band spectra of LiTaO3 and LiNbO3. |
| ü@ |
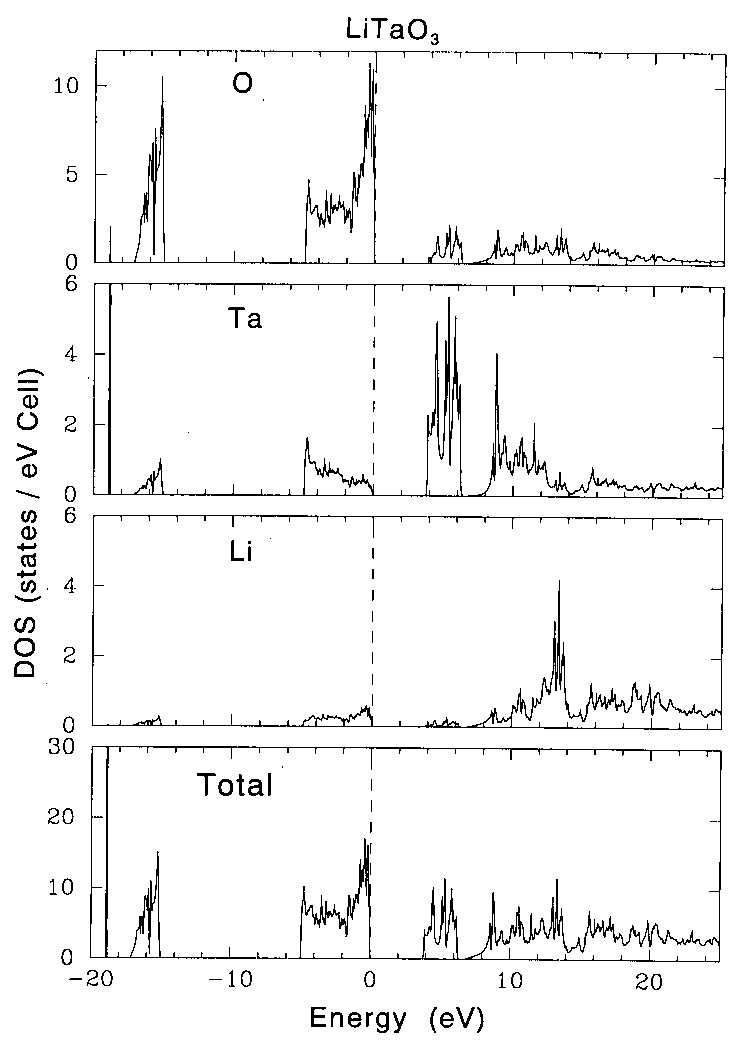 |
| Figure 3 Calculated density of states (DOS) for LiTaO3. (a) total DOS, (b) DOS of Li, (c)DOS of Ta and (d) DOS of O. The peaks at around -19 and -15 eV are the Ta 4f and O 2s electrons, respectively. |
| ü@ |
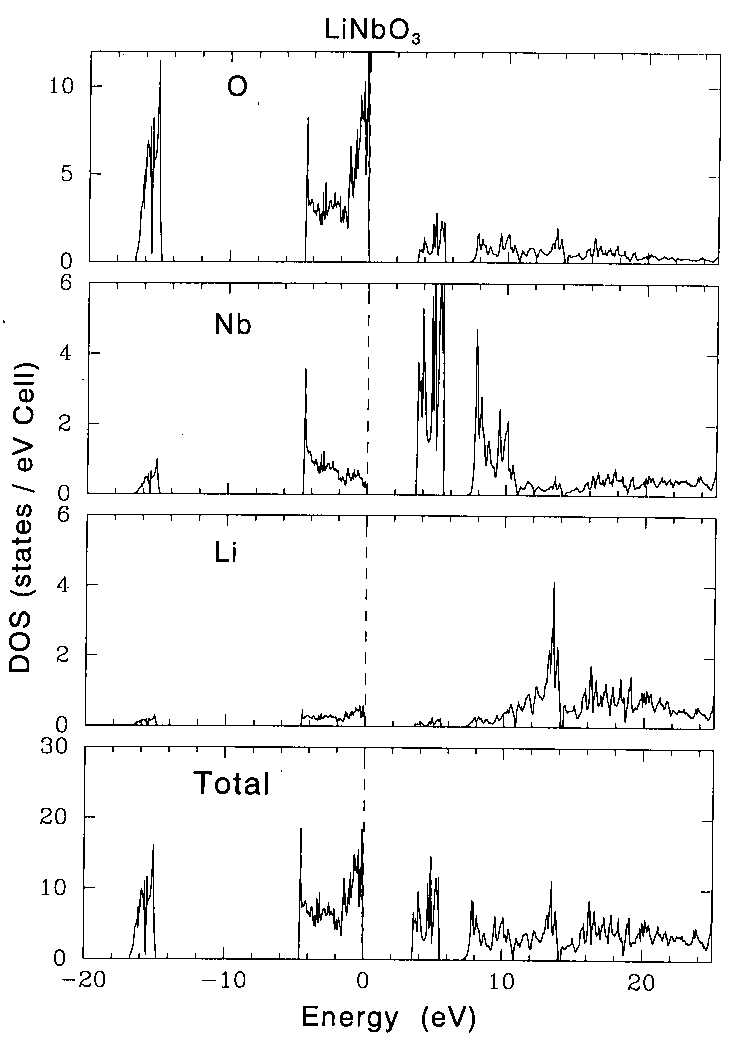 |
| Figure 4 Calculated density of states (DOS) for LiNbO3. (a) total DOS, (b) DOS of Li, (c) DOS of Nb and (d) DOS of O. The peak at around -15 eV is due to the O 2s electrons. |
| ü@ |
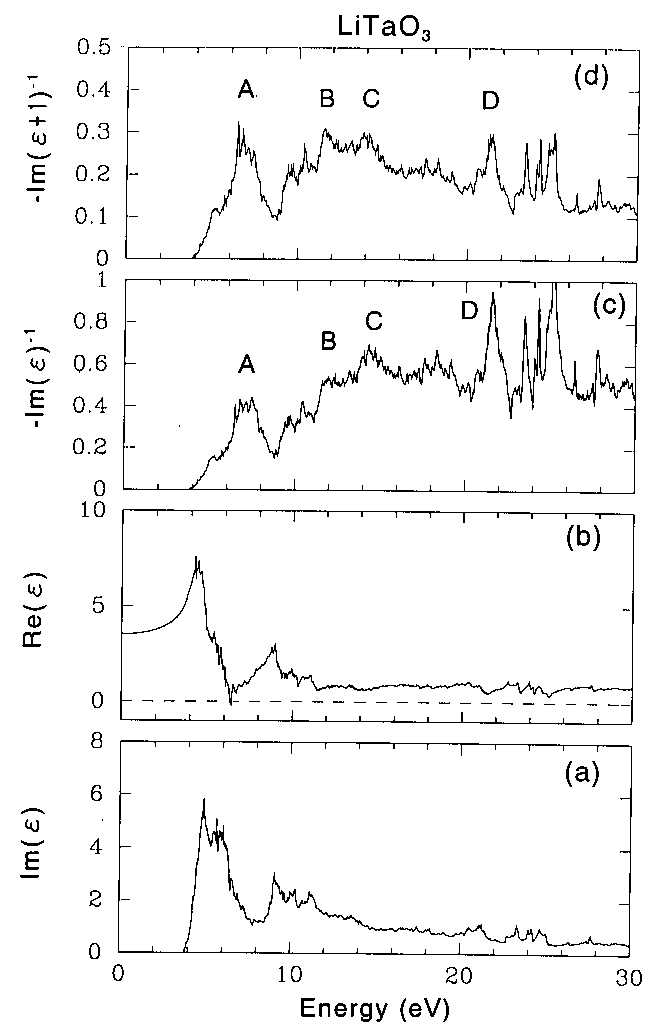 |
| Figure 5 Calculated dielectric function and electron energy loss functions of LiTaO3. (a) imaginary part and (b) real part of the theoretical dielectric function, (c) bulk and (d) surface electron energy loss functions. |
| ü@ |
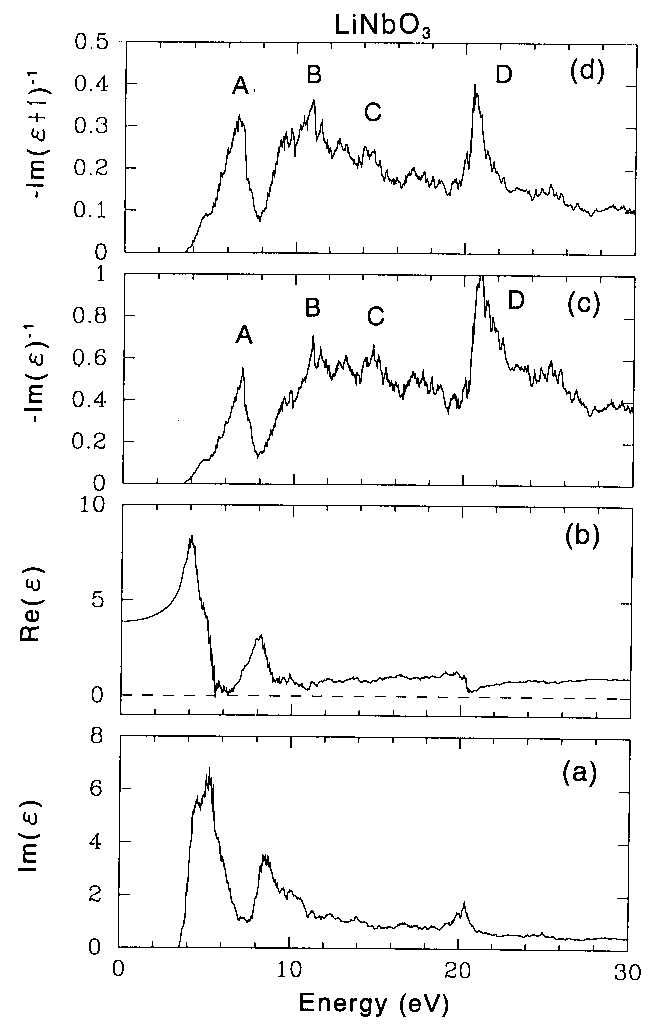 |
| Figure 6 Calculated dielectric function and electron energy loss functions of LiNbO3. (a) imaginary part and (b) real part of the theoretical dielectric function, (c) bulk and (d) surface electron energy loss functions. |